Personal project
2 weeks, January 2023 - February 2023
Current EV market in the U.S.
Electric vehicles are seen as a crucial technology for decarbonizing road transportation, which accounts for approximately 16% of global emissions. In the last five years, the number of EVs in the United States has grown rapidly, increasing by about 250%. As of 2021, there were approximately 2 million electric vehicles on the roads in the country.
Introducing Tricharge ⚡️
DURATION
MY ROLE
It sounds good to have EV. What is the problem?
Despite the significant growth of the electric vehicle (EV) market, charging remains a challenge. According to the Alternative Fuels Data Center, there are approximately 54,359 charging stations across the United States, with 50,930 (130,476 ports) of these stations being accessible to the public. While this number of charging stations is adequate for the current number of EVs, there is a hidden issue. There is a significant number of charging stations that are temporarily unavailable.
Out of the 50,930 public charging stations in the United States, 3,970 are currently unavailable due to issues such as maintenance or technical errors. Despite the availability of 46,960 open stations, a significant problem is the lack of connected data between the real-time situation at the charging stations and EV drivers.
Field Research
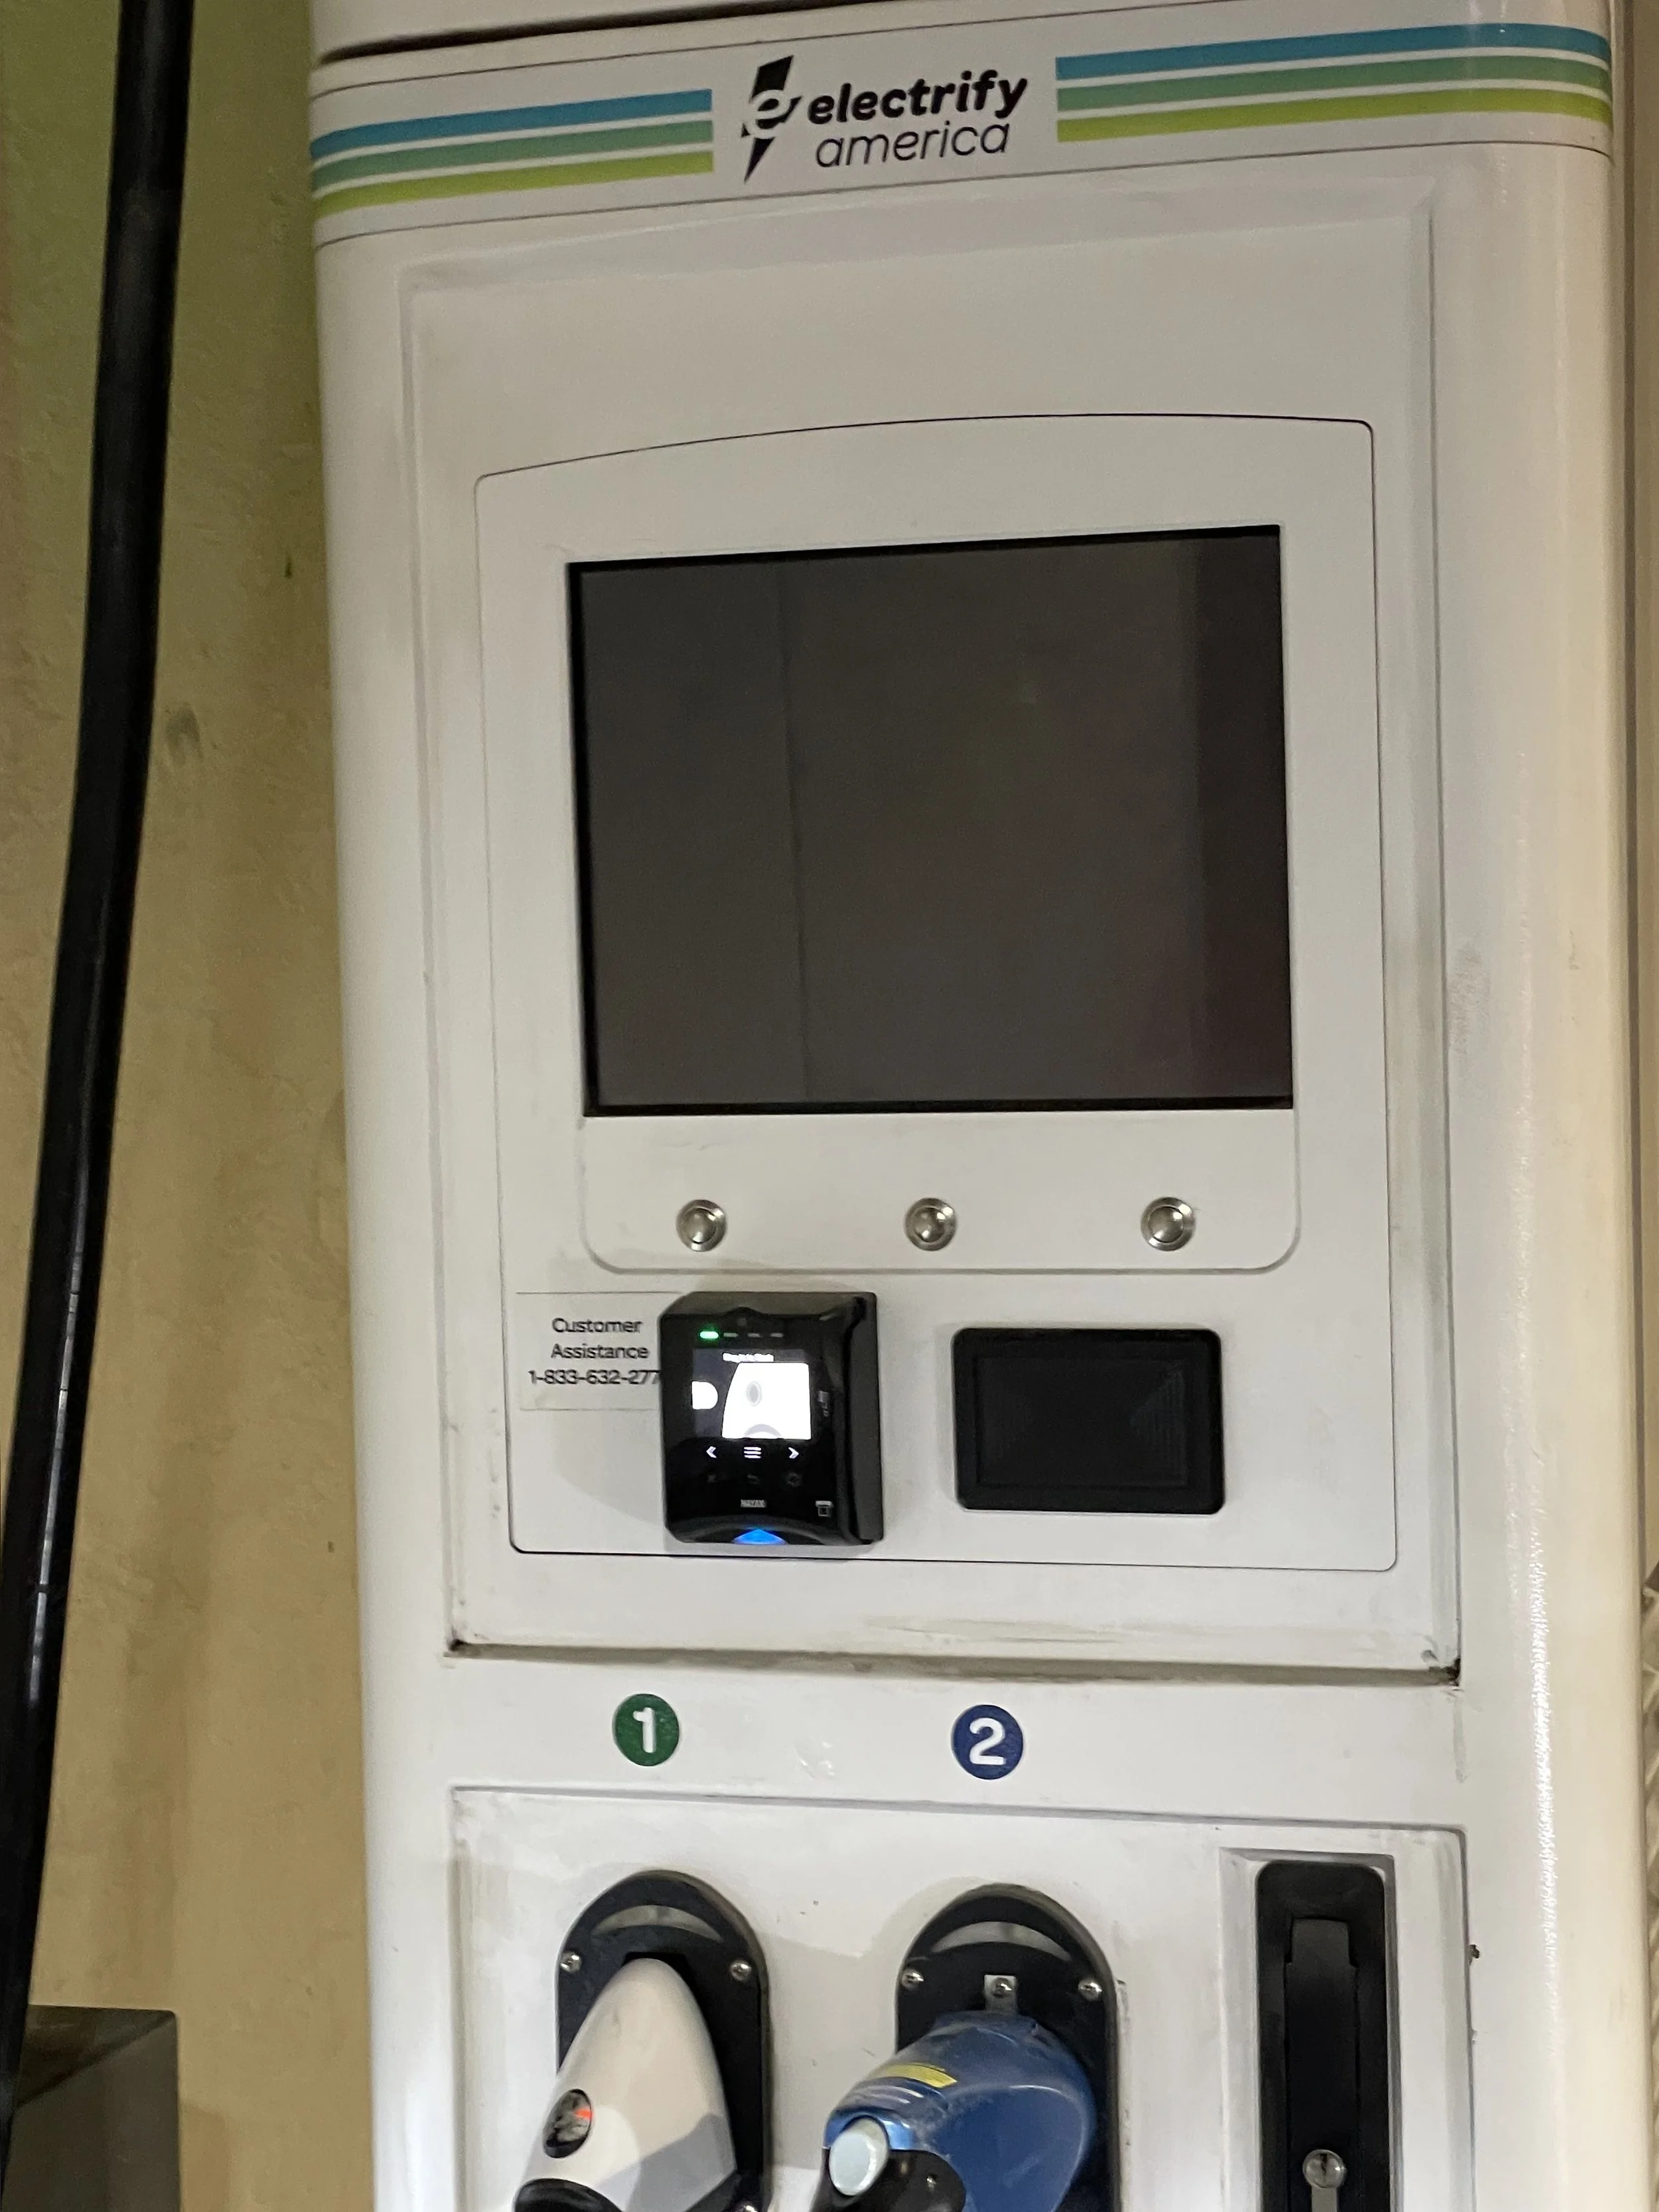
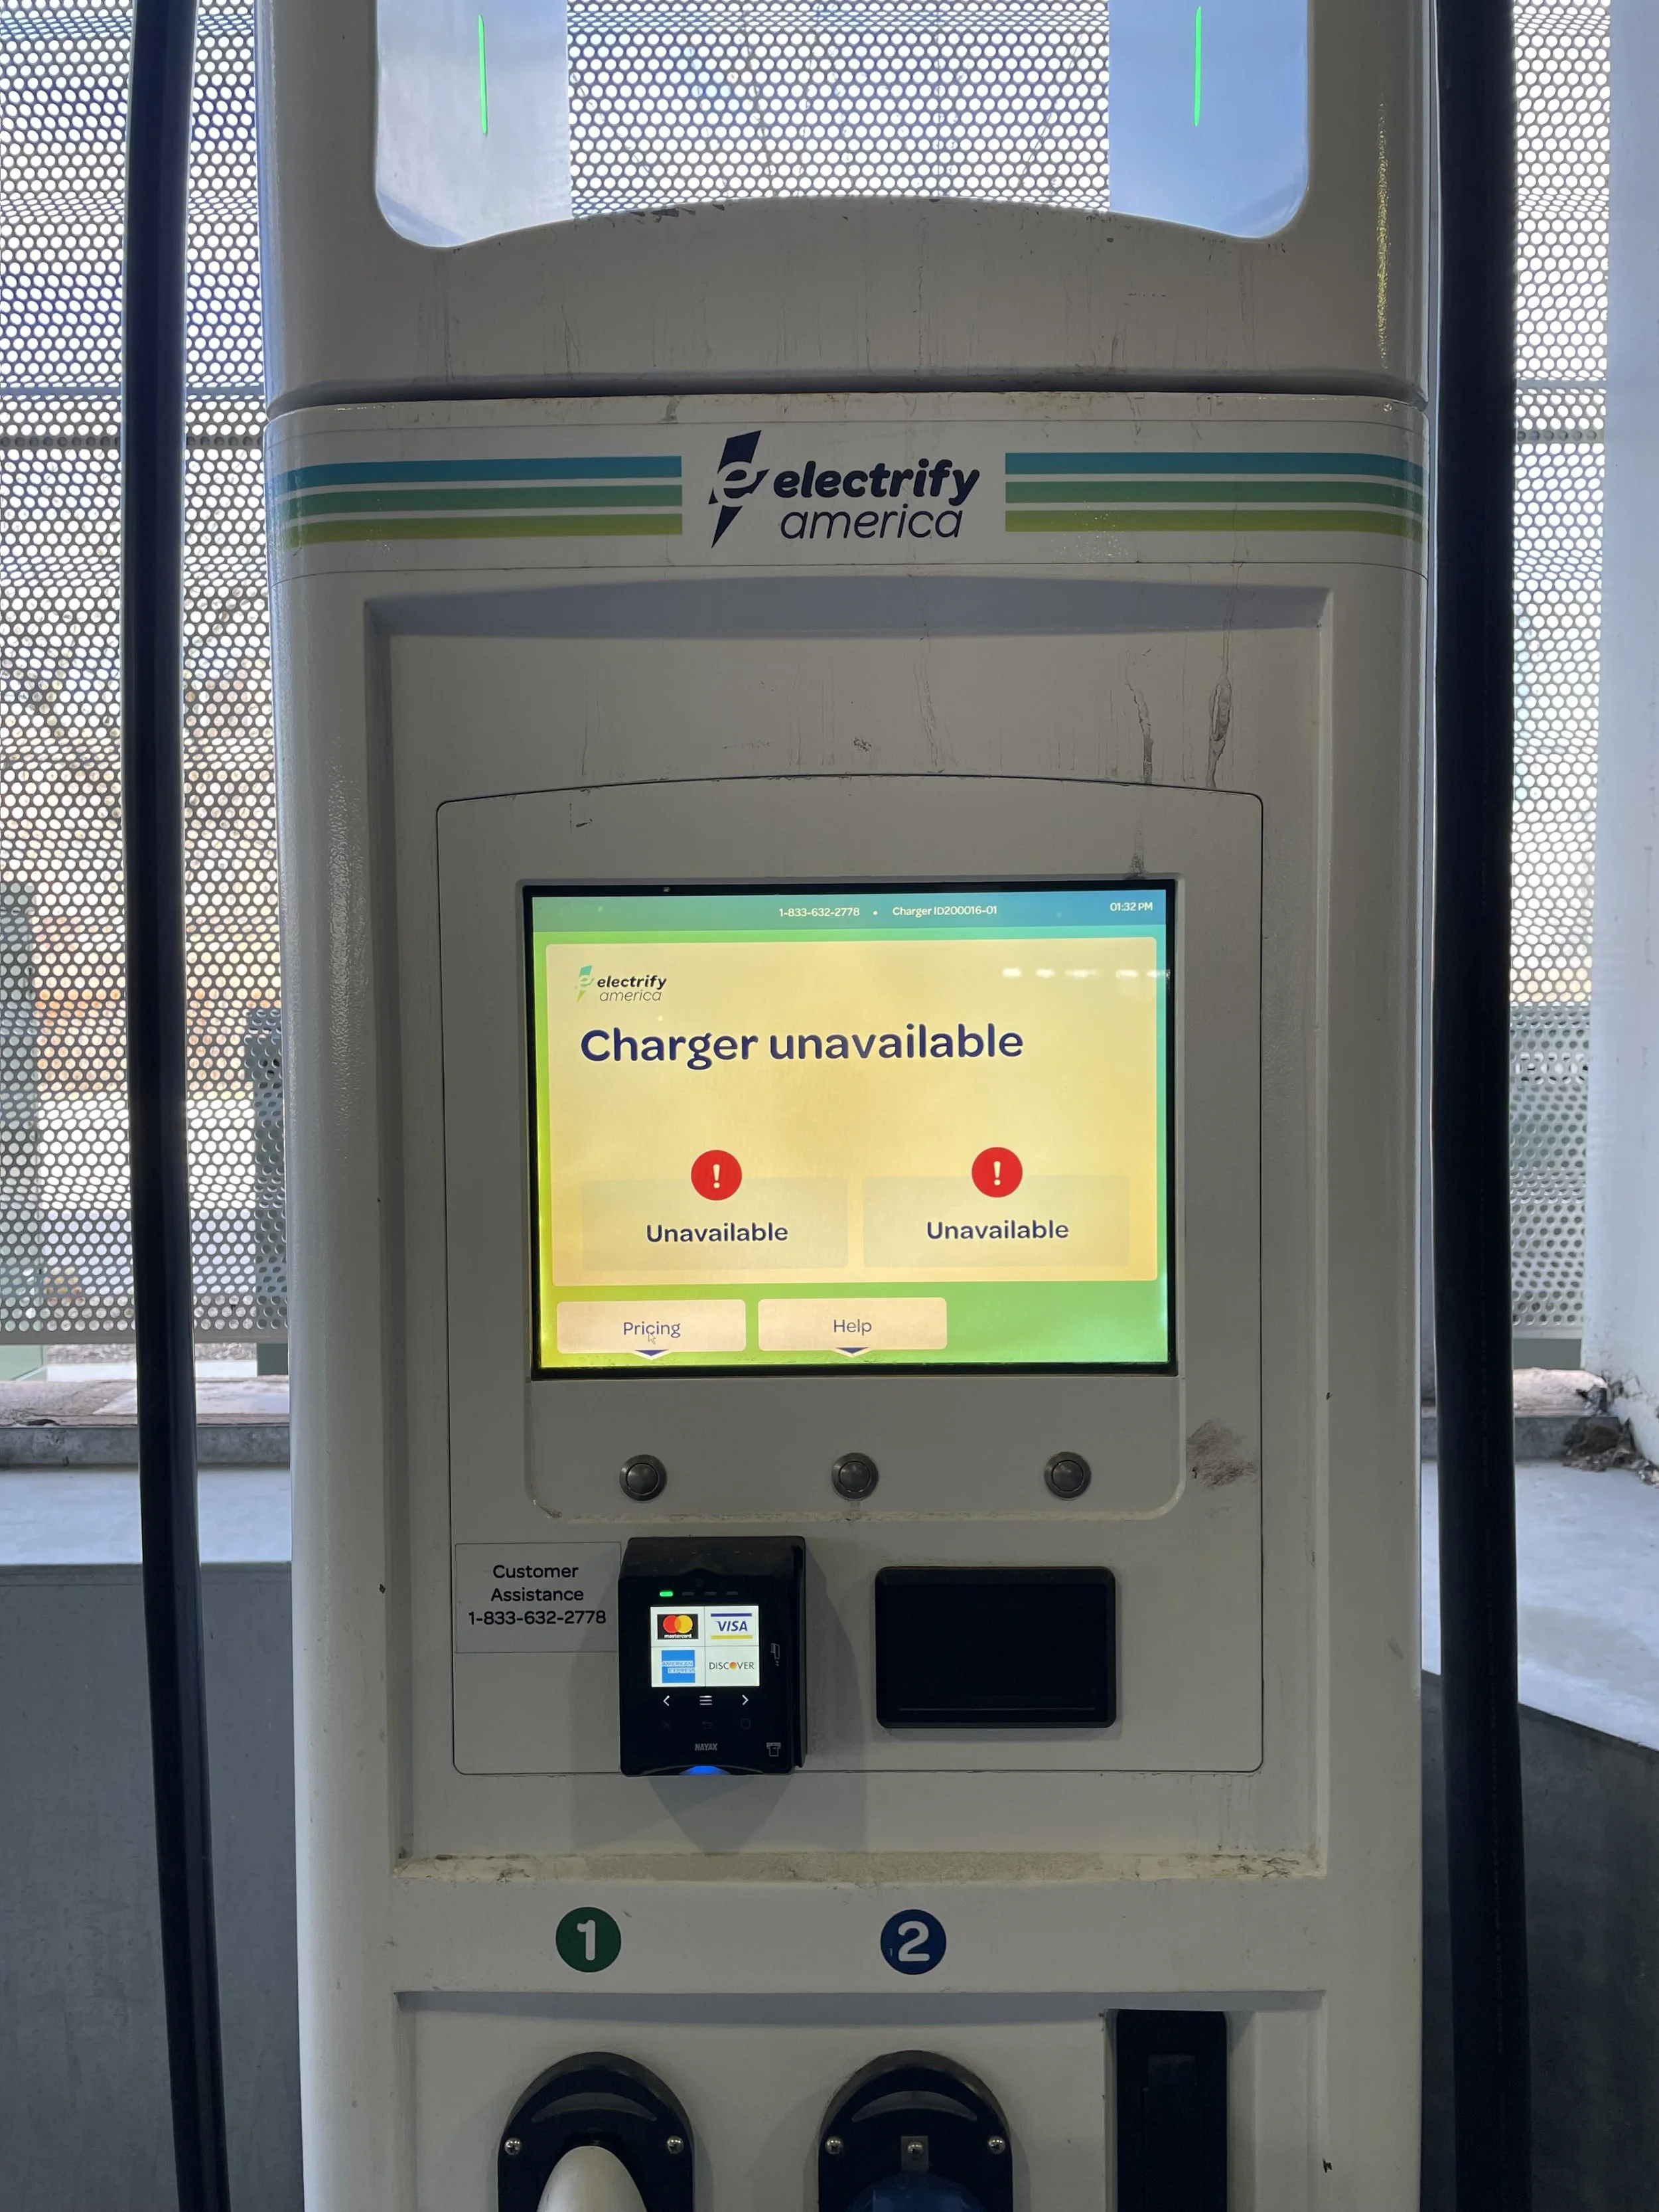
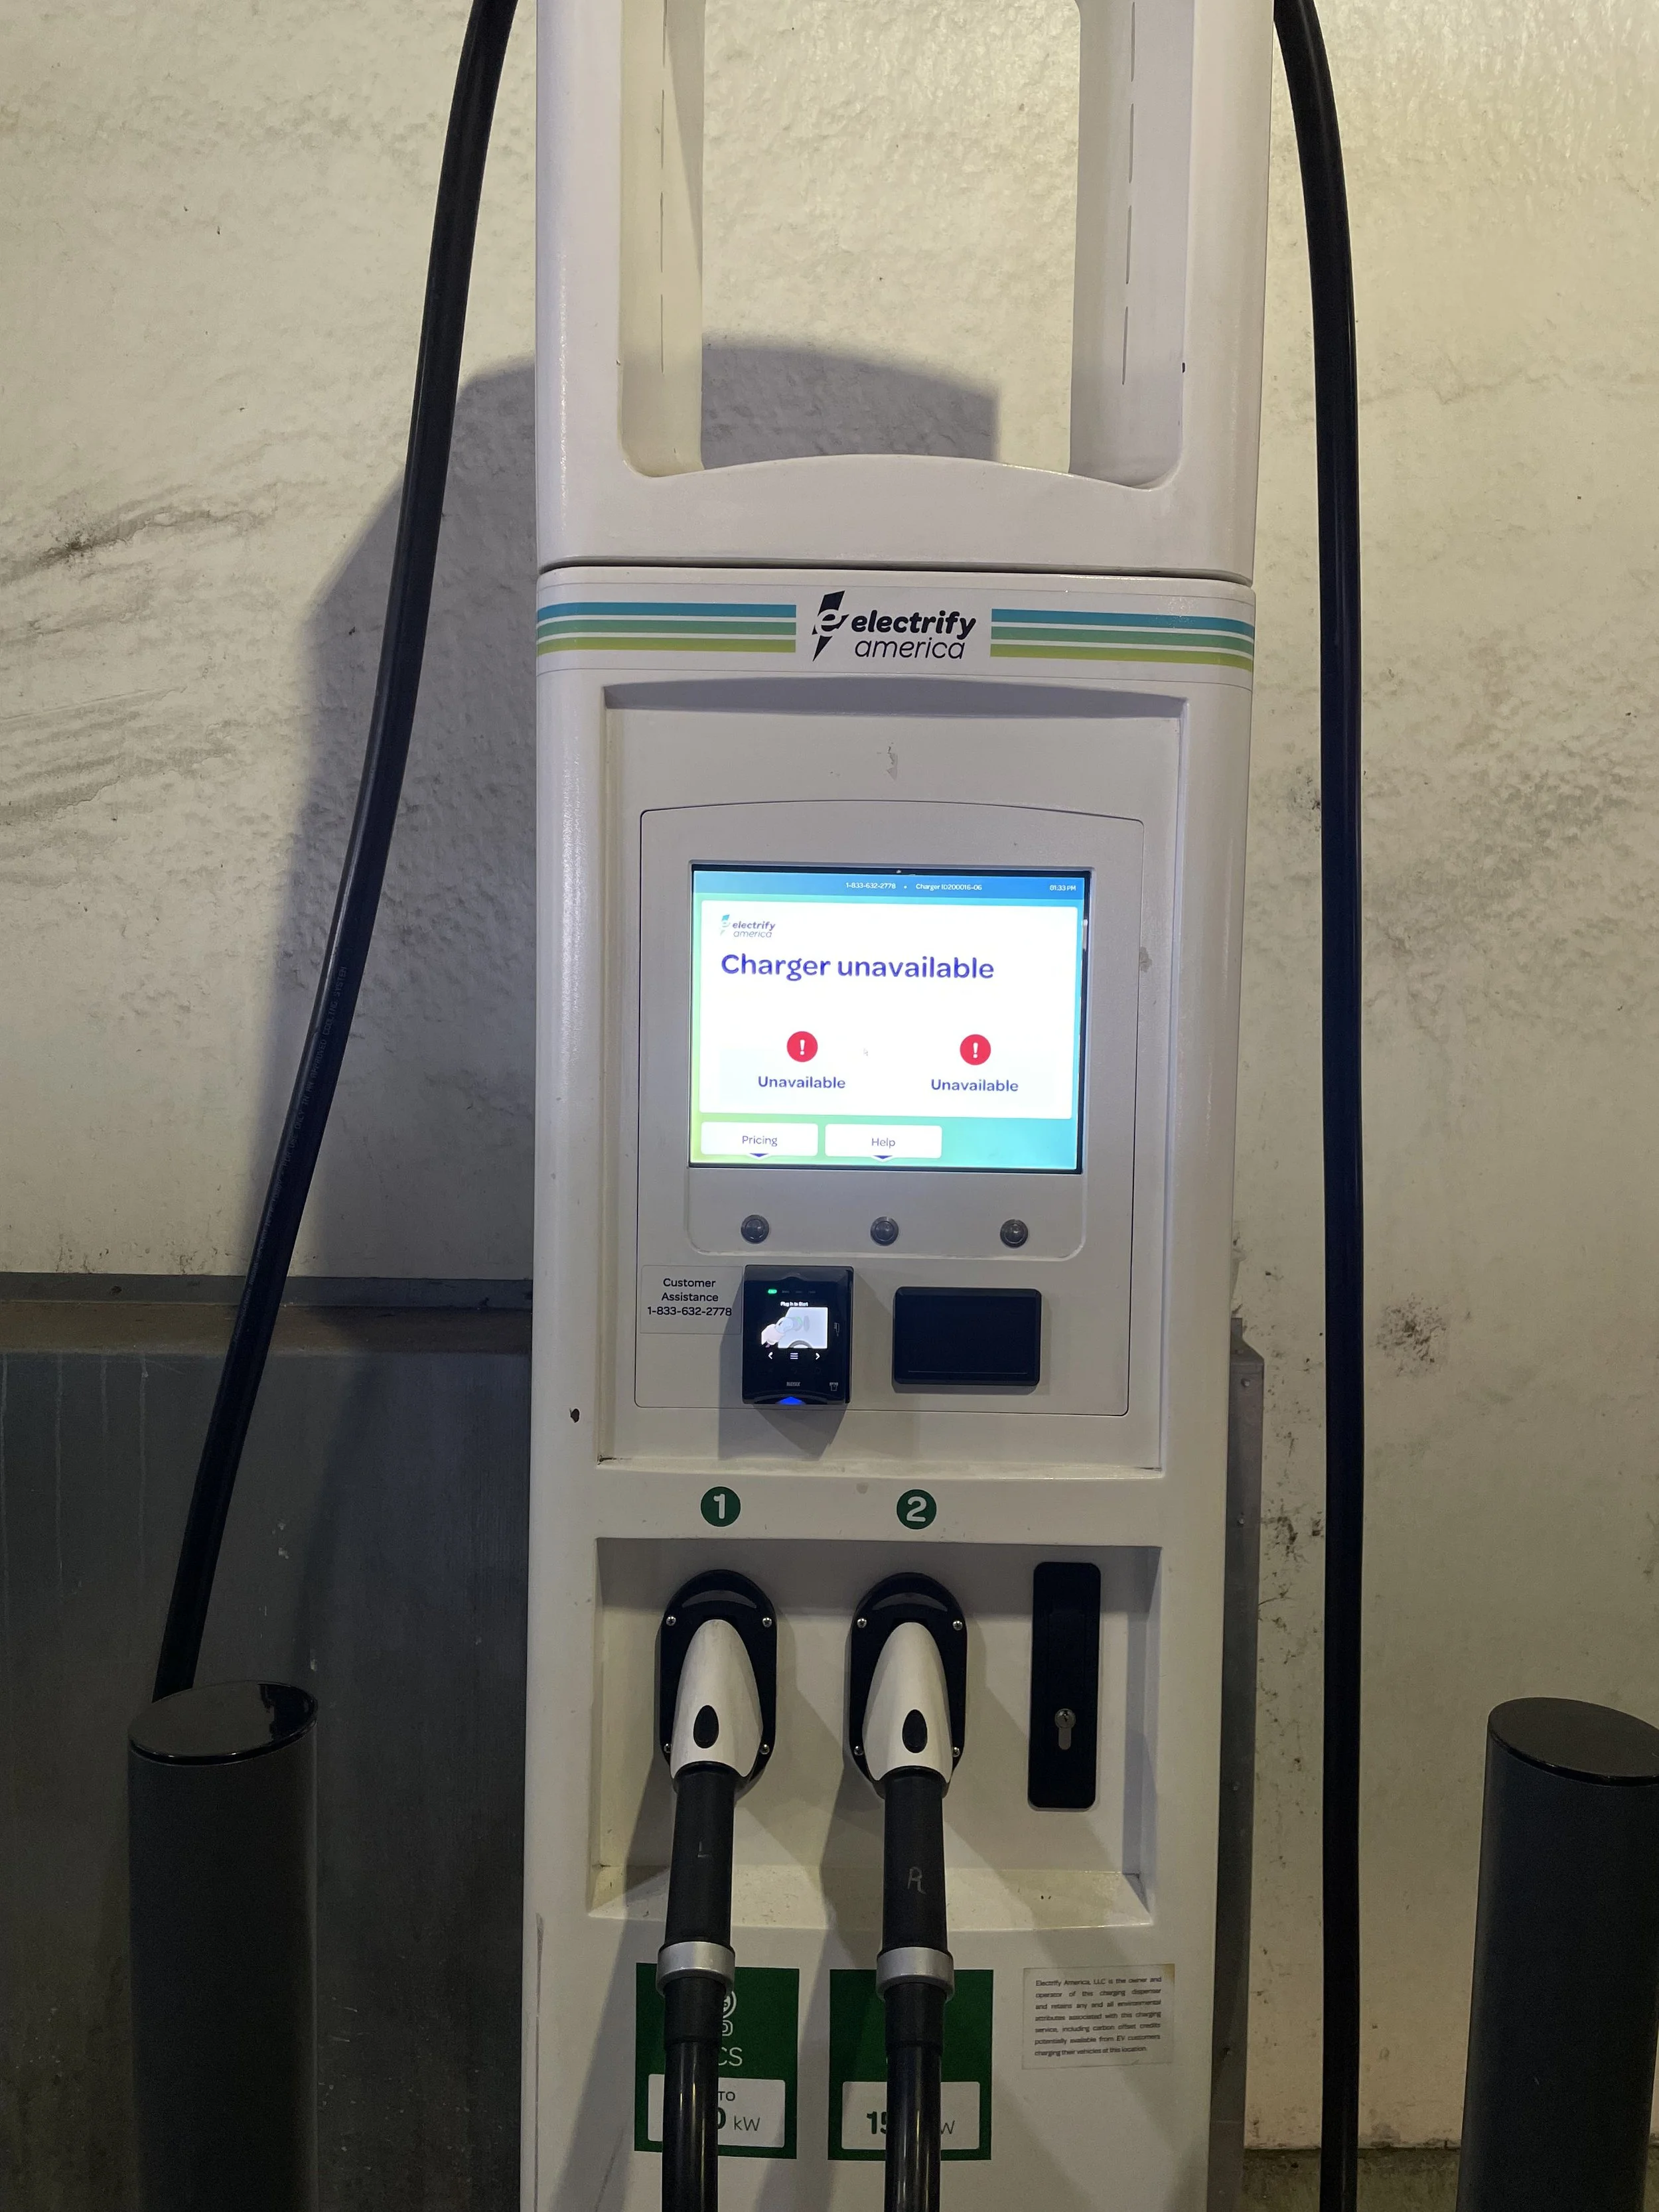
In order to gain a better understanding of stakeholders and create empathy, I conducted field observation and research around charging points in the Chicago area. After visiting and observing more than 8 charging stations, I discovered a significant discrepancy between the current station status information displayed on the app and the actual conditions at the charging stations.
Almost all of the charging station has a line of cars waiting for the port.
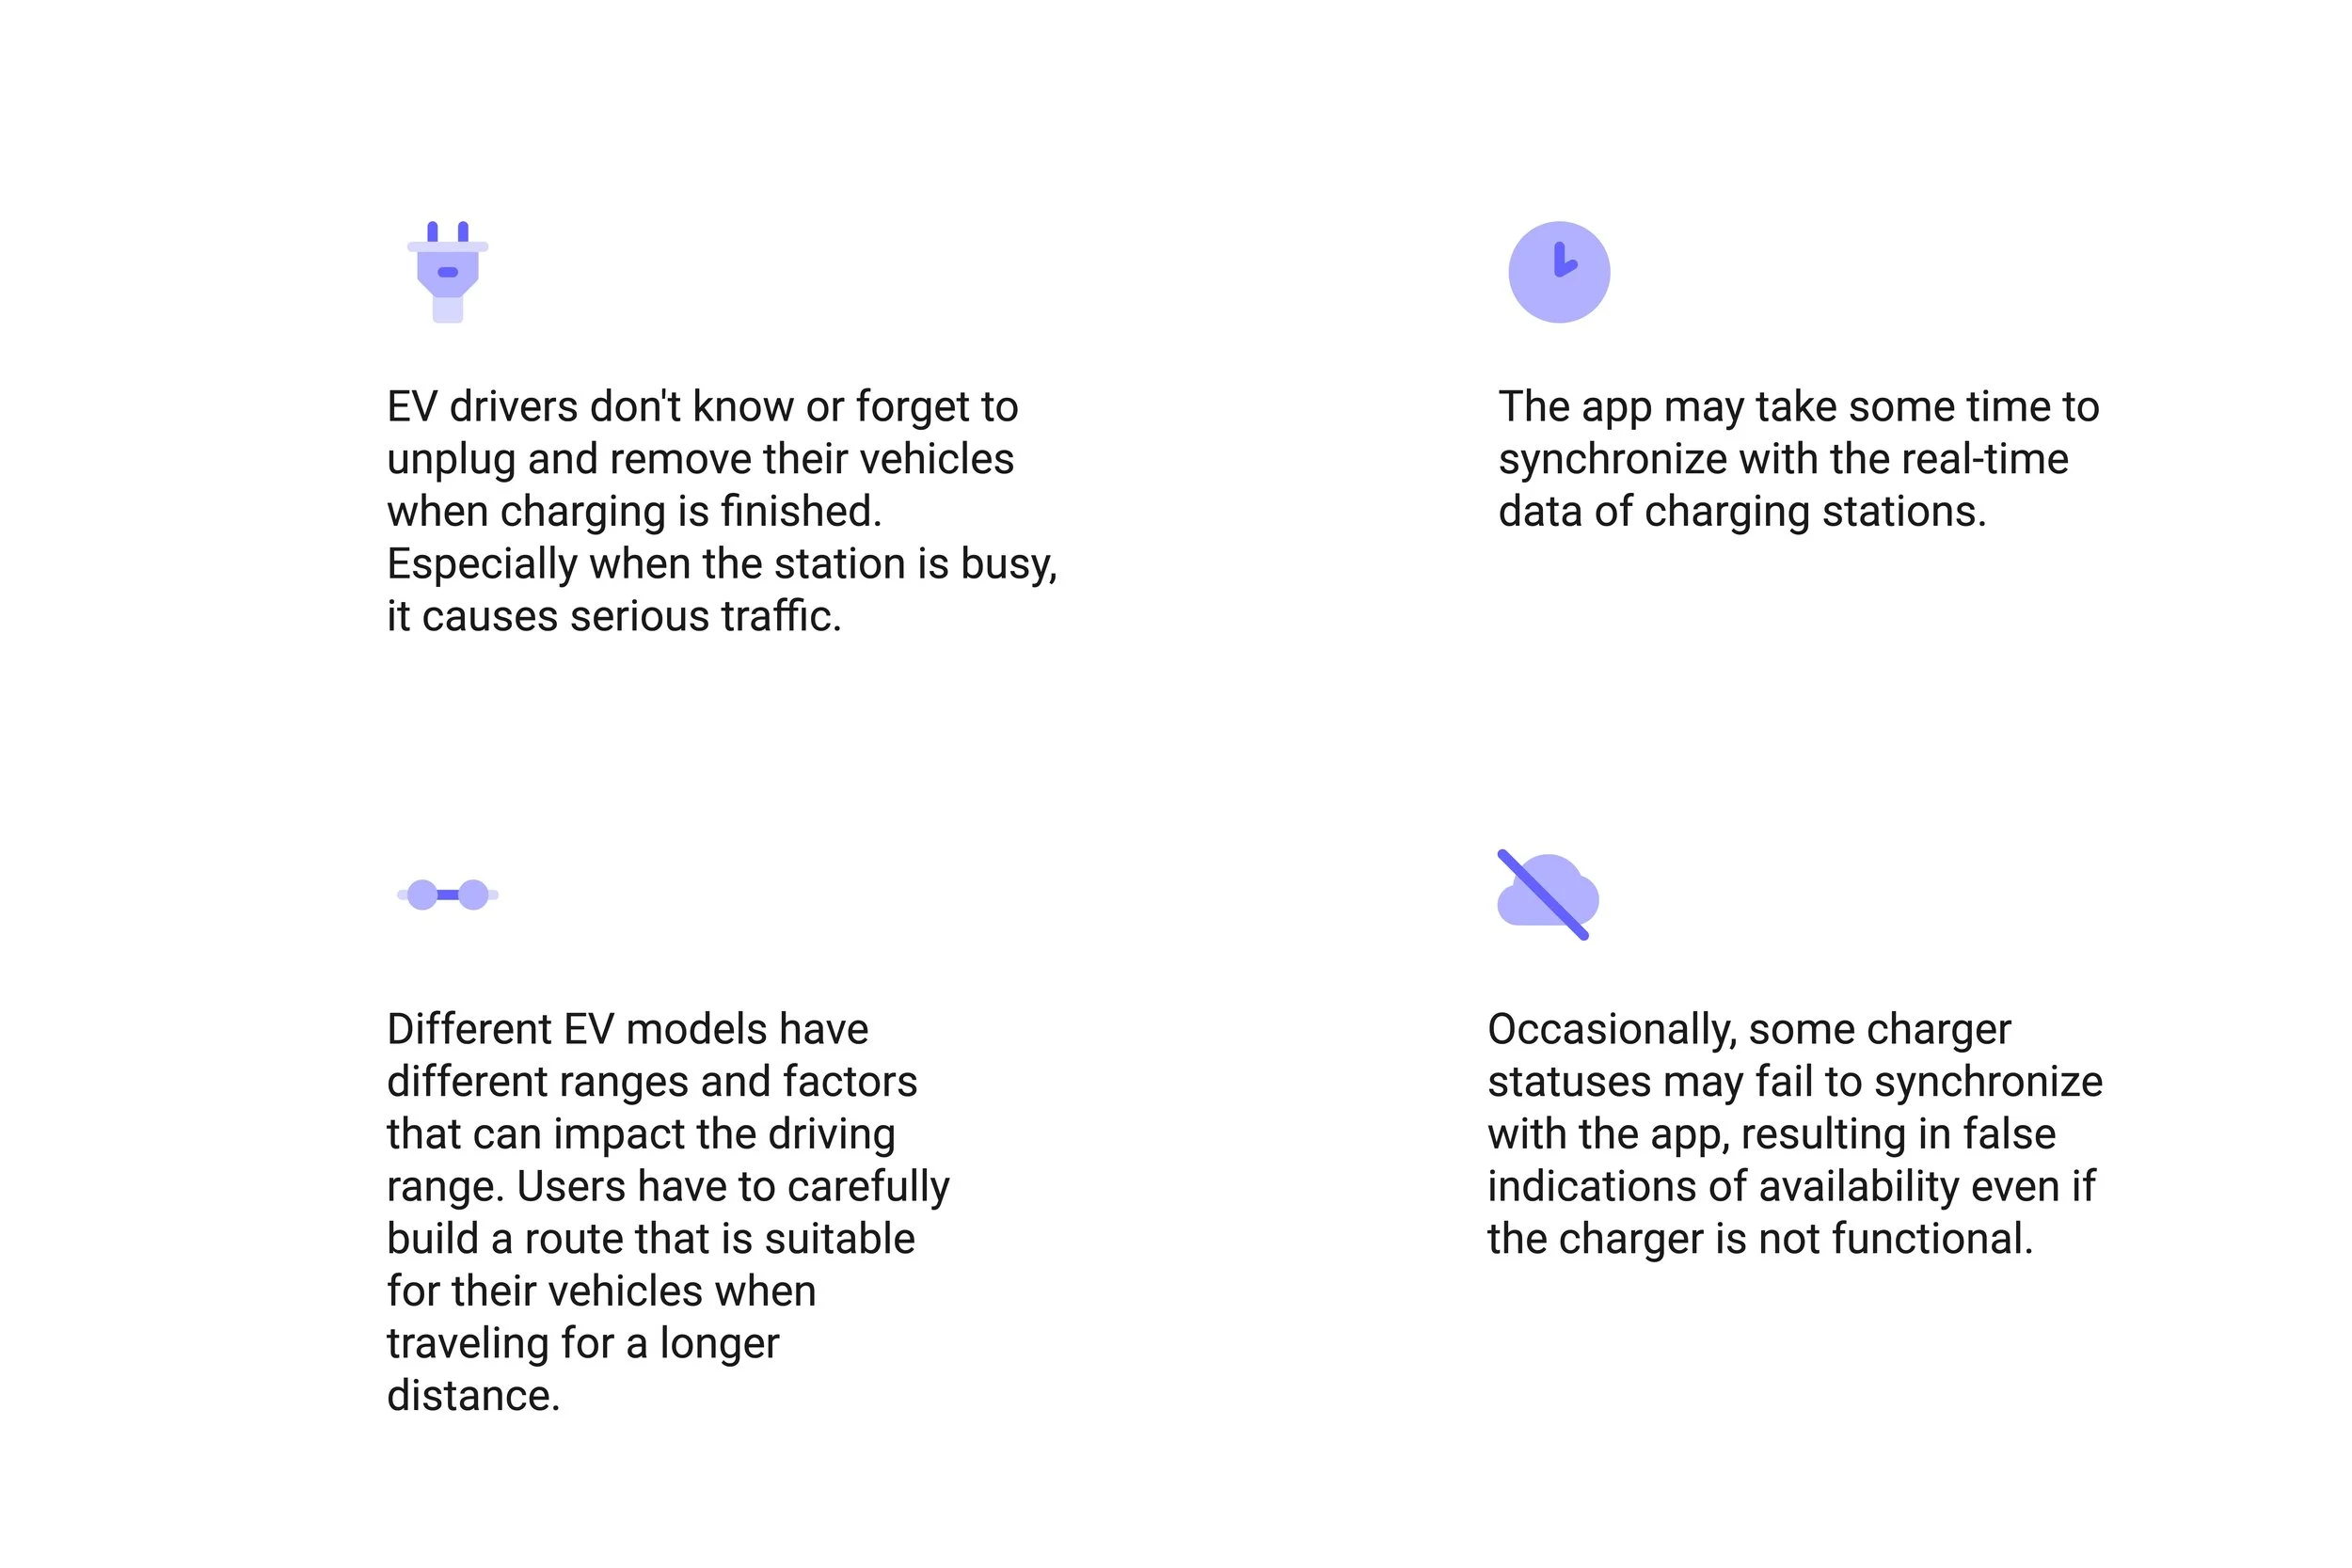
Despite the charge station navigation indicating that the station is available to users, the discrepancy between the app and the actual conditions at the station resulted in a line of vehicles waiting their turn to charge at most of the stations I observed.
Many of the waiting vehicles eventually gave up on charging and left the station after encountering difficulties with a broken charger.
During my observations of the 10 charging stations, I found that at least 1-2 charge points were out of service at each location. It often took a significant amount of time for the application to update the error information, which could lead to serious traffic issues in urban areas. This was particularly problematic since most of the charging stations had only 2-4 charge ports
Journey Map
Insights & Ideations
Solution
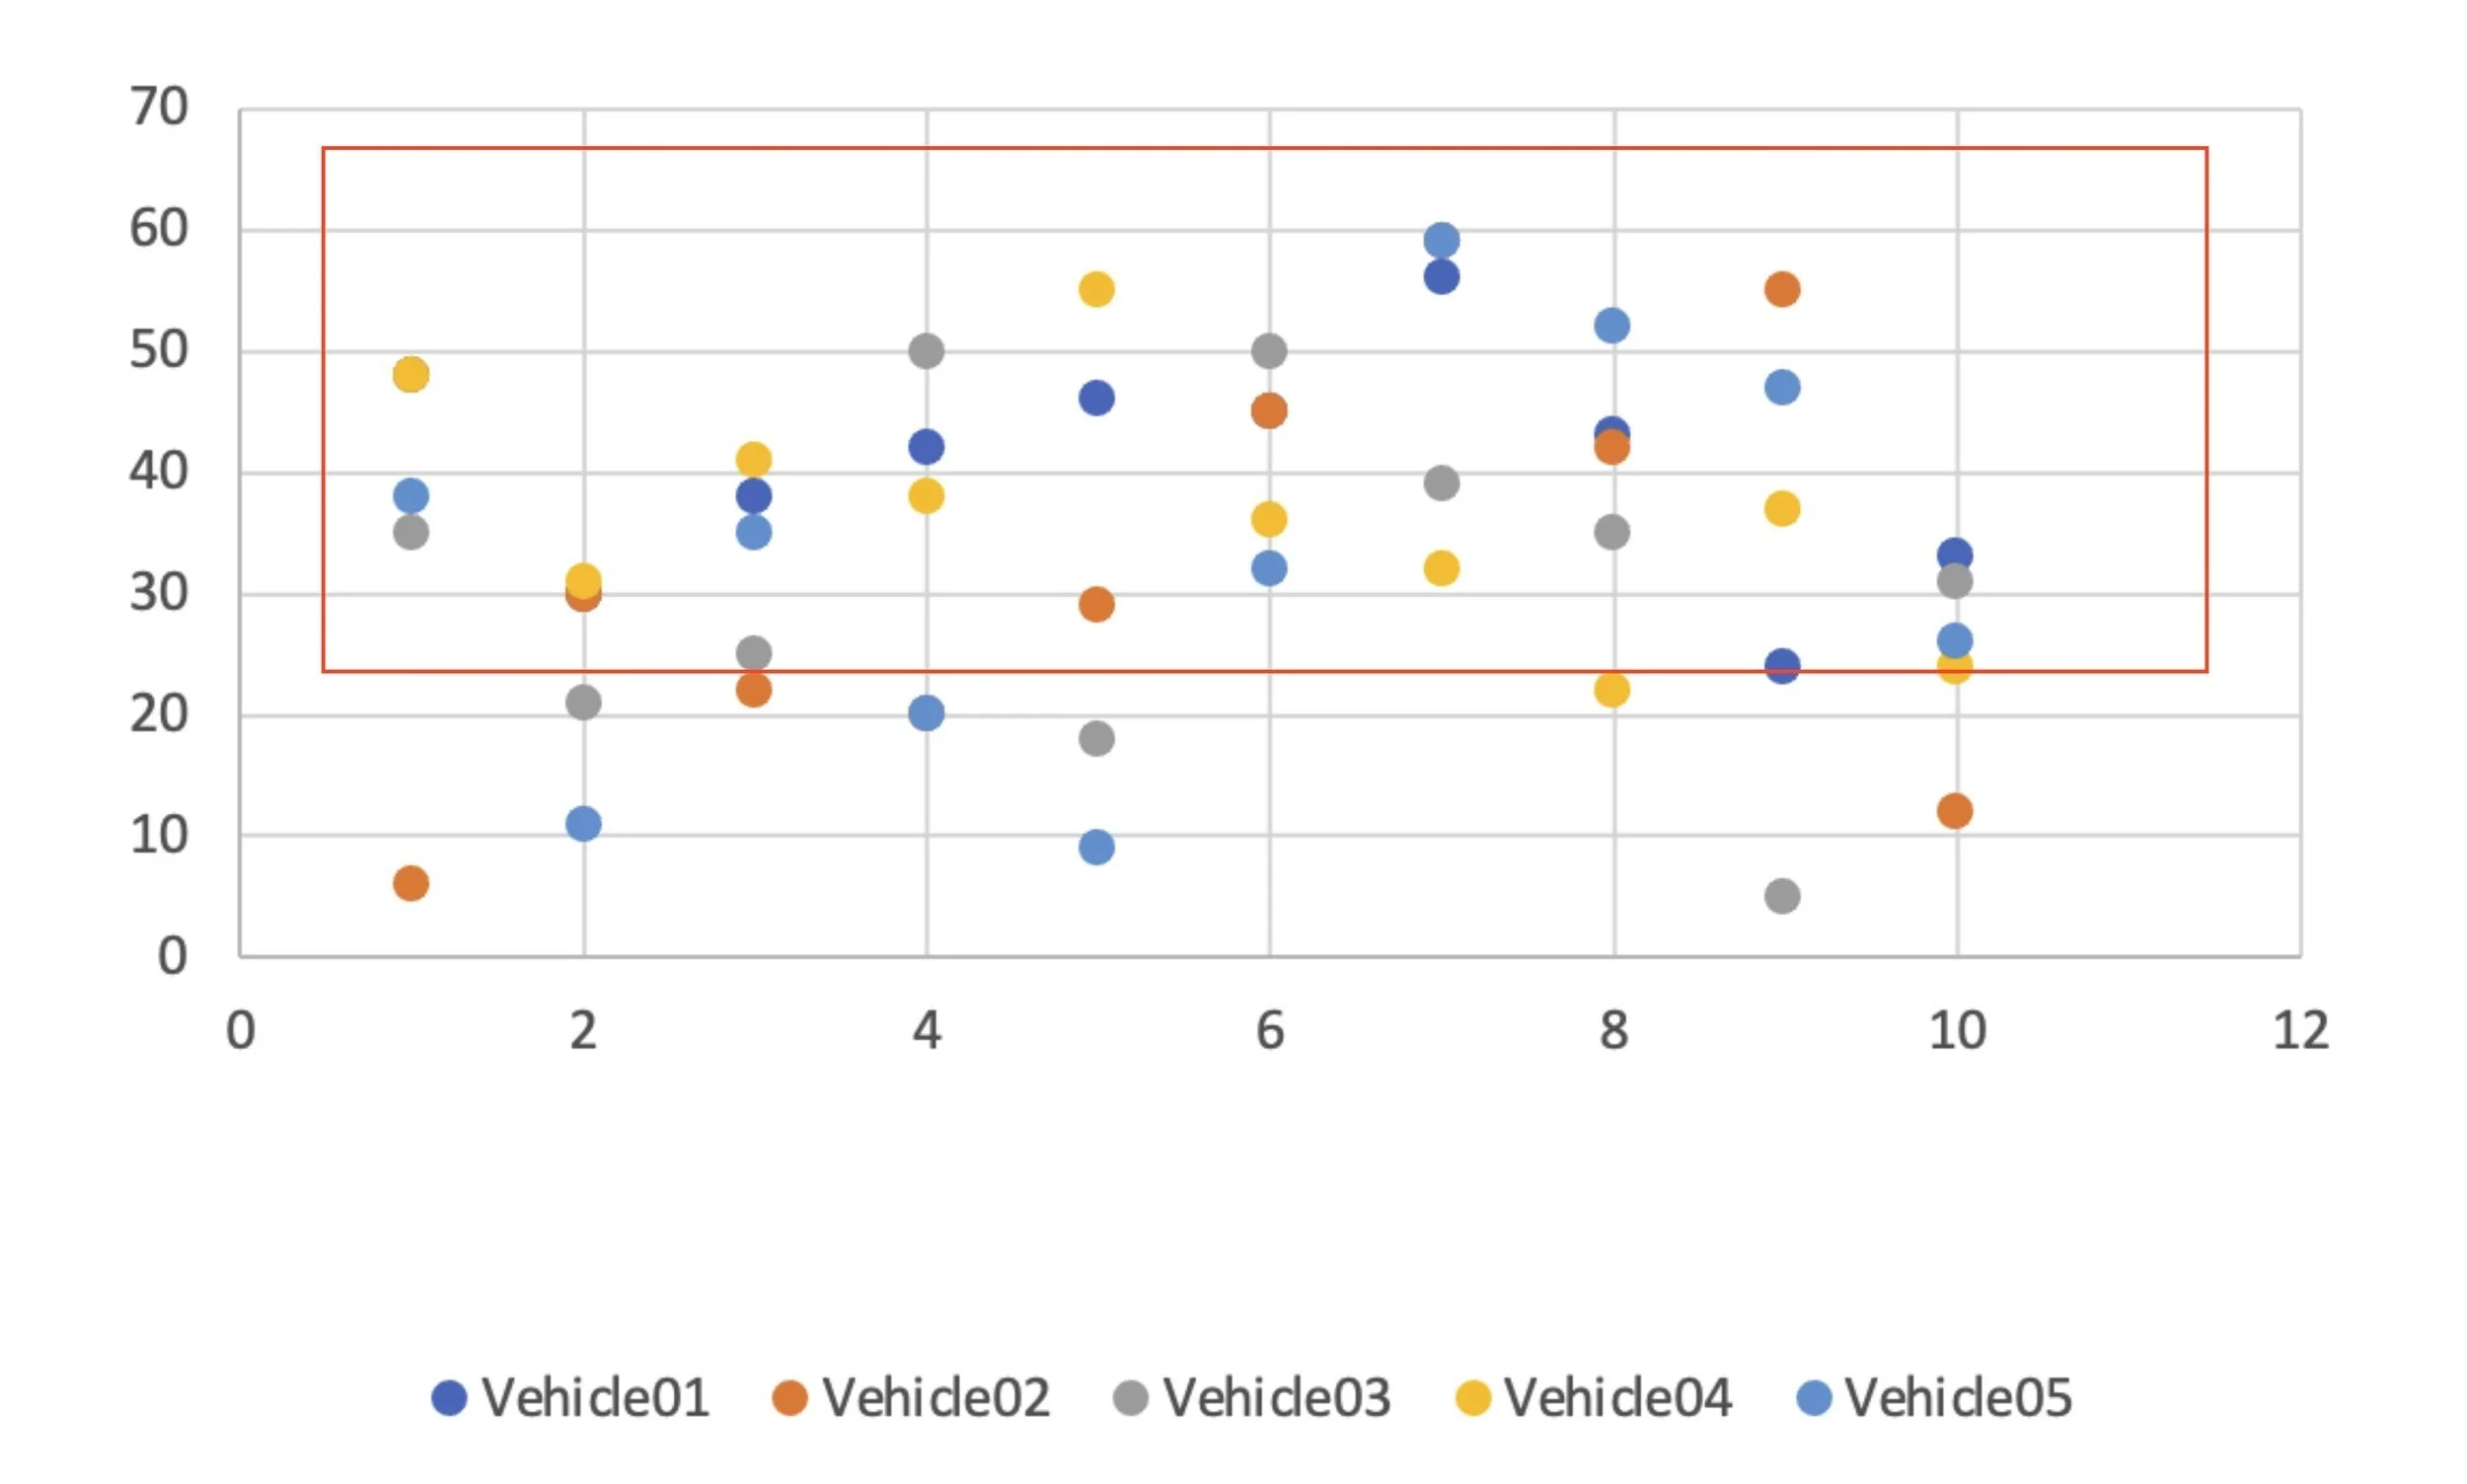
After conducting my observations, I have created a data table that shows the average charging times for vehicles when the charging process went smoothly without any errors. The data indicates that it took between 25 to 55 minutes to charge a vehicle on average.
Average Time Spend on Charging Station
Charge Station
Time
Based on this data, Tricharge can provide visual information to users to help them understand the success rate of charging
Three different mode that users can select
Exclude all the potential problem chargers
Likelihood of a Successful Charge
Determine the likelihood of a malfunctioning charger at a particular station by calculating the average time consumed per vehicle at the charging station. Present this information visually to aid users in their decision-making process.
Insights
Users can select and save their vehicle models on the app, allowing Tricharge to provide personalized information for optimized usability.
Customized feedback
Prevent users from forgetting to disconnect their EVs by sending real-time notifications with information on the current number of people waiting to use the charging station.
Include the charger data with stay time of 10 minutes above
(There is a potential problem with the chargers)
Thank you for reading!✨
Exclude all the potential problem chargers
Waitlist
This 2-week design sprint project was a new experience for me, providing a valuable opportunity to work on a fast-paced project within a tight timeline. Integrating new features into an established navigation service was a challenging process, as the navigation system has been in use for several decades, with only minor design changes to its core structure. This means that even slight modifications can result in a sensitive user response. Through this project, I gained a deeper understanding of the importance of considering different usage environments when designing services. Navigation is a task that requires the user's full attention, such as while driving. Therefore, it is crucial for the navigation system to be as intuitive as possible, allowing users to find the information they need with minimal distraction. I kept this in mind throughout the project.
Reflection
Moving forward + Next steps
Gather additional real-world charging data and build a larger model to enhance the accuracy of the charging probability offered by the service.
Develop a sophisticated prototype that integrates with the map API and conducts field tests to assess its performance in real-world environments.
Using the advanced prototype, conduct a demonstration to present the service to stakeholders (EV drivers) and gather their feedback.
Tricharge
My task for this project was to enhance the charging experience for electric vehicle (EV) owners through the development of an EV navigation solution. The goal was to make the charging process & experience smoother and faster for drivers by increasing the success rate of charging.


